Introduction
The goal of the project is to provide lightweight histograms in production samples. This project only generates the histograms. Rendering and comparisons to benchmarks are the responsibility of another project.
The focus is on simplicity and portability.
Overview
All of the code is written in python 2.7 and there are no other dependencies.
Very Broad Overview
The intended use for most people is going to be limited to adding histograms to production.
This project currently consists of one I3Module:
ProductionHistogramModule - This is the I3Module that you add to the end of your chain and has only four parameters. This module currently lives in production-histograms/python/icetray_modules/production_histogram_module.py.
Histograms - A list of either Histogram or HistogramModule class objects or instances.
OutputFilename - Name of the output pickle file, which contains the filled histograms.
Prescales - A dictionary with keys “Geometry”, “Calibration”, “DetectorStatus”, “DAQ”, and “Physics” whose data members (type int) are used to prescale the respective frames.
Usage
Producing Histograms
The first thing you might want to do is run the ProductionHistogramModule on your sample. Simply add the following to your script and set the ‘’Histograms’’ parameter accordingly.
from icecube.production_histograms import ProductionHistogramModule
from somewhere import MyHistogram
tray.AddModule( ProductionHistogramModule, Histograms = [MyHistogram] )
The ‘’Histograms’’ parameter takes a list of either class objects or instances of either Histograms or HistogramModules.
from icecube.production_histograms import ProductionHistogramModule
from somewhere import MyHistogram
my_histogram_instance = MyHistogram()
my_histogram_instance.frame_key = "Foo"
tray.AddModule( ProductionHistogramModule, Histograms = [my_histogram_instance] )
Scripts
There’s currently one script for combining pickle files produced from a production run into a single pickle file that can be compared to benchmarks.
The script is ‘’production-histograms/resources/scripts/combine_pickle_files.py’’
Usage: combine_pickle_files.py [options]

Options:
  -h, --help            show this help message and exit
  -i INPATH, --inpath=INPATH
                        Path to input pickle files.
  -o OUTFILENAME, --output_pickle_filename=OUTFILENAME
                        Name of output file with combined histograms.
There is one other script that could be useful for converting old pickle files to something more generic. Any pickle files generated prior to and including release V00-00-03, serializes the histogram object. This means you will need icetray to be able to read and view the histograms. In subsequent releases, the state was serialized as a dictionary, making the resulting pickle files icetray-independent.
usage: convert_old_pickle_files.py [-h] input

positional arguments:
  input       Pickle file to convert.

optional arguments:
  -h, --help  show this help message and exit
NB: This script overwrites the current file.
Examples
There are currently a few example scripts that will run on files at different levels. They simply run the I3Reader on input I3File(s) and dumps histograms into an output pickle file.
trigger - trigger_level_histograms.py
filter L1 - filter_level1_histograms.py
filter L2 - filter_level2_histograms.py
All have the same options.
Options:
  -h, --help            show this help message and exit
  -i INFILES, --infiles=INFILES
                        Regex to pass to glob that specify the input files.
  -g GCDFN, --gcdfile=GCDFN
                        Input GCD file.
  -o OUTPUT_FN, --output-filename=OUTPUT_FN
                        Filename of the output pickle file.
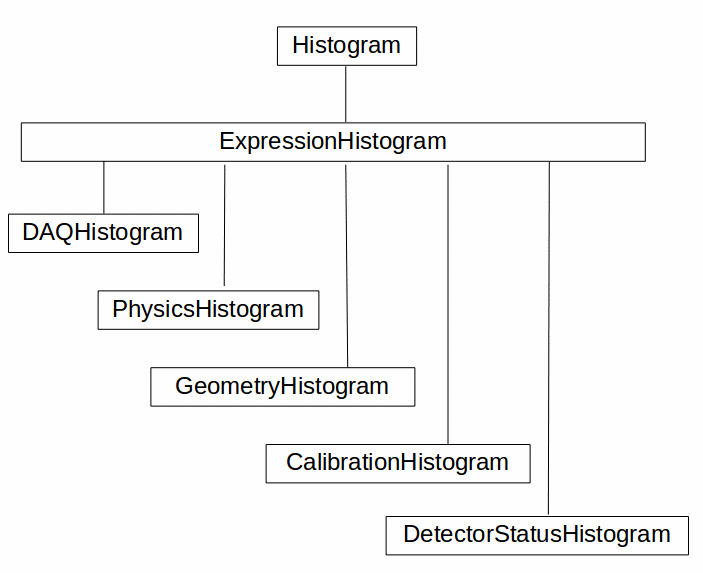
Class Hierarchy

This is the histogram class hierarchy.
Database
To get histograms directly from the database:
In [1]: from pymongo import MongoClient
In [2]: client = MongoClient('mongodb://icecube:skua@mongodb-simprod.icecube.wisc.edu') # read only access
In [3]: db = client['simprod_histograms']
In [4]: db.list_collection_names()
In [5]: collection_name = db.list_collection_names()[0]
In [6]: collection = db[collection_name]
In [7]: primary_energy = collection.find_one({'name':'PrimaryEnergy'})
In [8]: primary_energy.keys()
Out[8]: dict_keys(['_id', 'bin_values', 'name', 'underflow', 'xmax', 'xmin', 'overflow', 'nan_count'])
In [9]: filelist = collection.find_one({'name':'filelist'})['files']
In [10]: histogram_names = [h['name'] for h in collection.find({'name' : {'$ne':'filelist'}})]
